Microsoft Azure. "Charges" section
Charges section
To view the Charges section:
- Sign in to the Customer Control Panel.
- On the Application Dashboard, move the mouse pointer to the Azure Entry Point . The
 button is displayed in the lower right corner of the Entry Point.
 - Click . The Azure Entry Point menu is displayed.
- On the Entry Point menu, click Charges. The Charges page is displayed (see also -Subscription analytics).
- The Charges page contains the following elements:
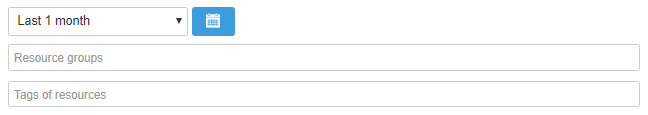
- Filters to select the required period, resource groups, and tags of resources to display resources usage and expenses information.
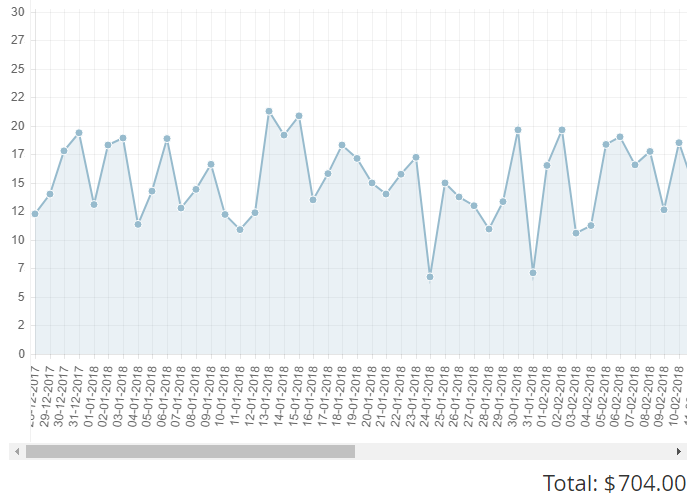
- The graph of the daily charge for the selected resource groups against time.
- The total amount of charge for the selected resources groups for the selected period.
The Detailed statistics button
 to download a file with information about Charges.
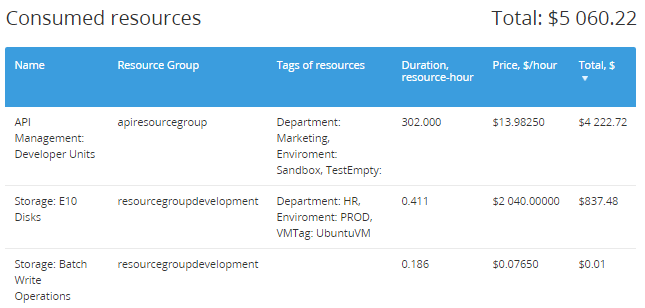
- The table with the Charges for each of the selected Groups for the selected period. The table lists the following information:
- Name — name and information of a Resource included in a Resource Group.
- Resource Group — Resource Group name.
- Tags of resources — the tags of a resource in Microsoft Azure.
- Price — Resource fee per hour.
- Discount — the discount amount for the selected period.
- Duration, resource-hour — total number of hours the Resource was used.
- Total — total Charge amount for the Resource, discount included.
- Filters to select the required period, resource groups, and tags of resources to display resources usage and expenses information.
Using filters
You can use the following filters to display information about your expenses:
- Time period to show on the graph and to calculate the expenses.
- Resource Groups.
- Tags of resources.
Selecting the time period
You can select the required period using the list box with the predefined values (last month, last three months, last six months, last 12 months), or using the  to select a custom time period.
The graph and the table are updated automatically after changing the time period.
Selecting the Resource Groups
You can view your expenses for each Resource Group for the selected time period. To select the required Resource Groups:
- Click Selected resource groups to view the full list of Resource Groups. You can start typing the name of a Resource Group to filter the list.
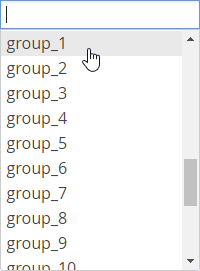
Click the required Resource Group. Click the list box again to add another Resource Group.
To exclude a selected Resource group, click
 .
.The graph and the table will be updated automatically.
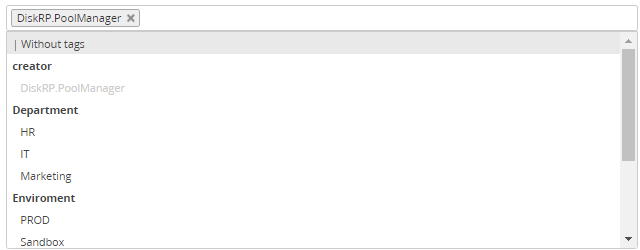
Selecting the Tags of resources
Using the Tags of resources filter is similar to the Resource Group filter. The values of available tags in the filter are grouped by the tag names.
Downloading a file with detailed statistics
To download a report with information about Charges:
- Click the Detailed statistics button .
- In the appeared menu, select the preferable file format:
- Microsoft Excel (.XLSX)
- CSV
The file in the selected format is downloaded automatically. The report contains data from the Consumed Resources table with applied filters.
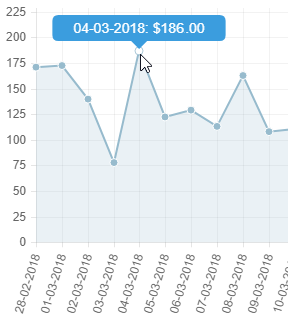
Working with the graph
The Charges graphs allows you to see the daily amount of expenses for the selected Resource Groups. Move the mouse pointer to a point on the graph. The screen tip with the date and the amount of a daily charge appears.
For Subscriptions in the Stopped status, the last day in the graph represents the day when the Subscription was stopped.
Working with the table
You can sort the table by clicking one of the following column headers:
- Name
- Resource Group
- Price
- Discount
- Duration, resource-hour
- Total
Consumption of resources with the included quantity
The Microsoft Azure service may offer the included quantity of a Resource that can be consumed for free every Billing period. The quantity of such Resource consumed above the included must be paid by a customer on a common basis.
While processing the consumption statistics received from Microsoft, the platform checks whether the included quantity is offered for a Resource. If the included quantity for the Resource is greater than 0, for the consumed quantity within the included limit, the cost is set equal to 0. If the consumed quantity exceeds the included limit, the platform generates two records: one record is for the part within the limit of the included quantity and uses the cost equal to 0, and another record is for the part that is greater than the included limit and uses the cost calculated on a common basis. Further consumption of the Resource until the end of the Billing period is charged on a common basis. In the table with the Charges, the resource consumption records within the included limit are displayed as follows: Price = 0, Total = 0.