Microsoft Azure. "Analytics" section
The Analytics section is used for analyzing monthly consumption of the Microsoft Azure resources by resource categories. The consumption data is for informational purposes only and cannot be used for payments.
Information about consumed resources is displayed in the language that is set in the Application template (see Creation of the Microsoft Azure Application template based on the Office365 plugin).
To view the Analytics section:
- Sign in to the Customer Control Panel.
- On the Application Dashboard, move the mouse pointer to the Microsoft Azure Entry Point. The
 button is displayed in the lower right corner of the Entry Point.
 - Click
 . The Entry point menu is displayed.
 - On the Entry point menu, click Analytics. The Consumption Analytics page is displayed.
The Consumption Analytics page contains the following elements:
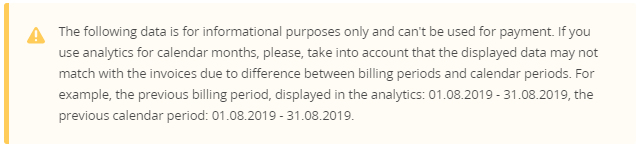
- The information message that explains informational purposes of the displayed consumption data and the possible difference between invoices and the monthly consumption data.
- Filters to select the required period, resource groups, and tags of resources for displaying the consumption data. The displayed consumption data is updated automatically on every change of a filter. The following filters are available:
- Period. The following values are available:
- Last 3 months.
- Last 6 months (by default).
Last 12 months.
The current month is not included in any selected periods.
- Period type. The following values are available:
- Calendar periods — calendar months will be used for displaying the consumption data.
- Billing periods — Billing periods will be used for displaying the consumption data (by default).
Resource Groups.
To select the required Resource Groups:
- Click Selected resource groups to view the full list of Resource Groups. You can start typing the name of a Resource Group to filter the list.
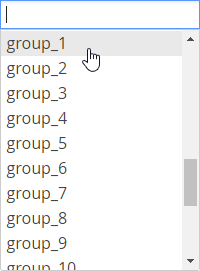
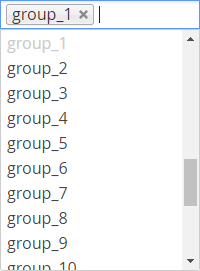
Click the required Resource Group. Click the list box again to add another Resource Group.
To exclude a selected Resource group, click .
.
Select all required Resource Groups.
- Click Selected resource groups to view the full list of Resource Groups. You can start typing the name of a Resource Group to filter the list.
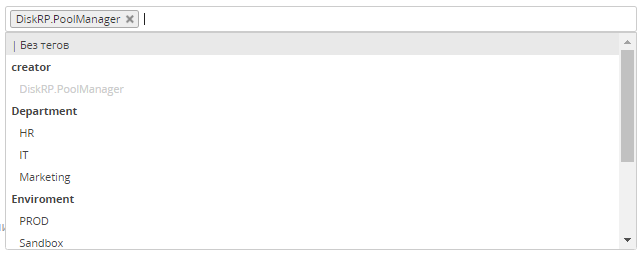
Tags of resources.
Using the Tags of resources filter is similar to the Resource Group filter. The values of available tags in the filter are grouped by the tag names.
- Period. The following values are available:
General cost structure by resource category — a doughnut chart where each segment shows the proportional value of resource consumption per resource category. The segments have labels with the resource category names and percent values.
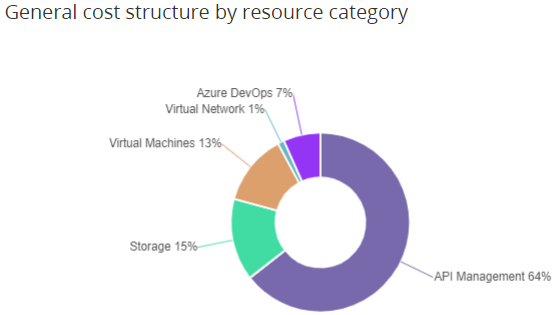
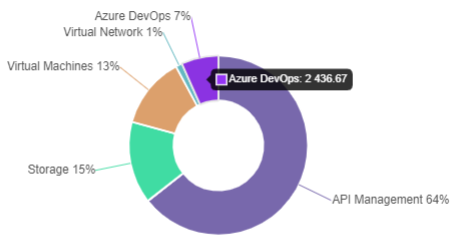
To view the cost of a certain resource category, hover the mouse pointer over the corresponding sector of the General cost structure by resource category chart. The tooltip with the resource category name and the cost with up to two decimal places is displayed.
To display the Monthly cost structure by resource category data for a certain resource category, click the corresponding sector of the General cost structure by resource category chart. As as the result:
- The other sectors of the General cost structure by resource category chart become faded.
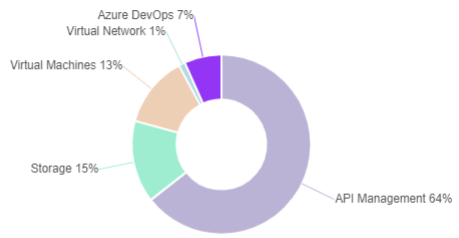
- The Monthly cost structure by resource category chart and the table display the data for the selected resource category only.
To reset filtering by resource category, click the selected sector of the General cost structure by resource category chart one more time.
- The other sectors of the General cost structure by resource category chart become faded.
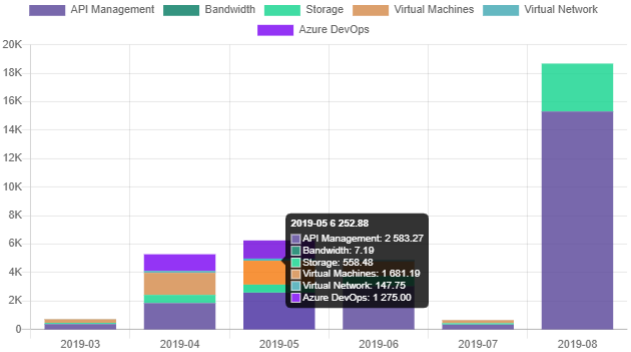
Monthly cost structure by resource category — a stacked bar chart and a table that display the cost structure of the consumed resources by resource categories per month in the selected period. The table also has the total values for every resource category and the grand total for all categories in the selected period. The costs are displayed with up to two decimal places. Months are displayed in the YYYY-MM format.
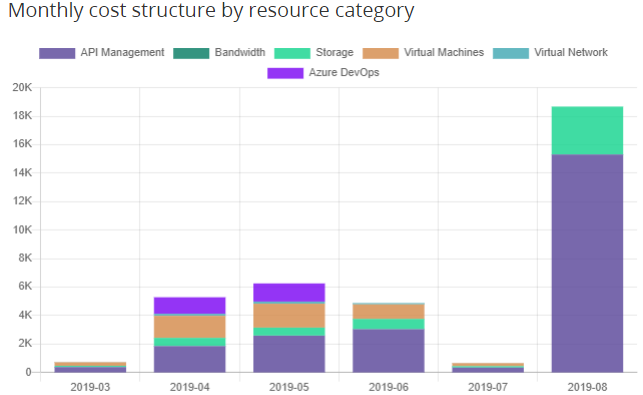
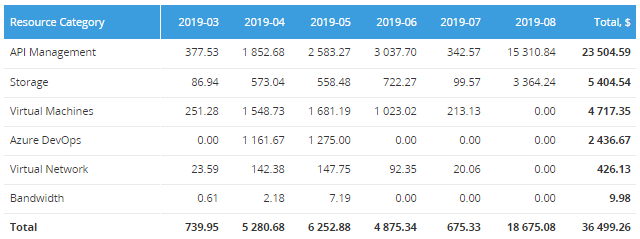
To view the cost of all resource categories for a certain month, hover the mouse pointer over the corresponding column of the Monthly cost structure by resource category chart. The tooltip with the total cost of all resource categories and the costs per every category with up to two decimal places is displayed.
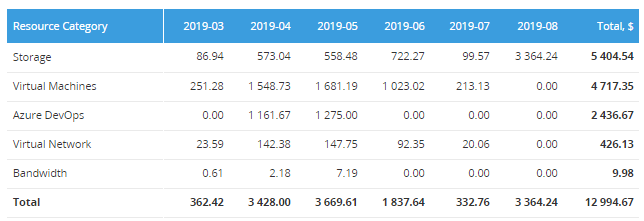
To exclude a certain resource category from the Monthly cost structure by resource category chart and the table, click its name in the chart legend. As as the result:
- The Monthly cost structure by resource category chart is updated and does not display the excluded resource category.
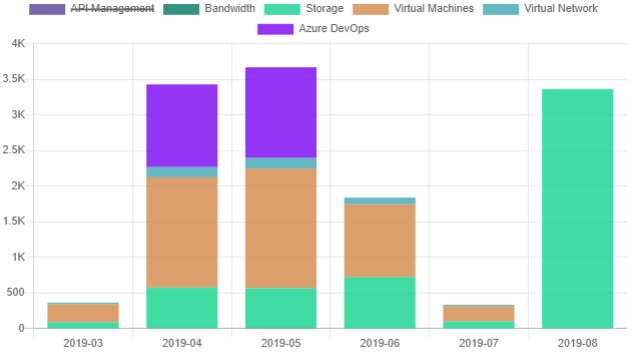
- The table is updated and does not take into account the costs of the excluded resource category.
To view the consumed data for only one resource category in the Monthly cost structure by resource category chart an the table, you can use filtering in the Monthly cost structure by resource category chart (see above).
- The Monthly cost structure by resource category chart is updated and does not display the excluded resource category.