Viewing Charges for a Subscription

Information about Charges for a Subscription is available in the Analytics section and includes structured information about Charges represented per Resource (Resource category) — on a monthly basis (for all Services) and on a daily basis (for Services that use the external storage for the Resource consumption data, for example, Microsoft Azure).

In the Analytics section, all costs are displayed in the Reseller currency regardless of the Plan currency.

For postpaid Subscriptions with prices fixed in a currency that differs from the Reseller currency, costs in the current Billing period may be changed. Recalculation of the costs is performed if the Reseller updates the currency exchange rate (see Screen Layout).

To view the Analytics section:

  1. Sign in to the Customer Control Panel. The Subscriptions section is displayed (see Viewing the list of Subscriptions).
  2. Hover the mouse pointer over an Entry Point. The  button is displayed in the lower right corner of the Entry Point.
  3. Click . The Entry point menu is displayed.
  4. On the Entry point menu, click Analytics. The Analytics page is displayed with the Resource consumption data for the filters set by default.


To configure the display filters:

  1. In the Granularity list, select the display breakdown for the Resource consumption data:
    • Daily
    • Monthly

    The Daily granularity is available only for Services that use the external storage for the Resource consumption data (for example, Microsoft Azure, see "Microsoft Azure" service). For these Services, the date when the platform processed the consumption record (UTC+3 timezone) is used.

    For other Services, the Monthly granularity is selected by default and cannot be changed.

  2. In the Period list, select the displayed period for the data:
    • For the Daily granularity, the following options are available:

      • Current billing period.
      • Previous billing period.
      • Custom billing period — the period of up to 3 consequent Billing periods limited by the Billing days.
      • Custom calendar period — the period of up to 3 consequent calendar months starting from any day.

      To select a custom billing period:

      1. In the Period field, click the dates range. The calendar with the list of months is displayed.
      2. Click the first month of the required period. The selected month is highlighted.
      3. Click the last month of the required period. The months within the period are highlighted.
      4. In the calendar, click OK. In the Period field, the dates of the selected billing period are displayed.

      To select a custom calendar period:

      1. In the Period field, click the dates range. The calendar with the list of days is displayed.
      2. Click the first day of the required period. The selected day is highlighted.
      3. Click the last day of the required period. The days within the period are highlighted.
      4. In the calendar, click OK. In the Period field, the dates of the selected calendar period are displayed.
    • For the Monthly granularity, the following options are available:

      • 3 billing periods.
      • 6 billing periods.
      • 12 billing periods.
      • Custom billing period — the period of up to 12 consequent Billing periods limited by the Billing days.
      • Custom calendar period — the period of up to 12 consequent calendar months starting from any day.

      To select a custom billing period or calendar period:

      1. In the Period field, click the dates range. The calendar with the list of months is displayed.
      2. Click the first month of the required period. The selected month is highlighted.
      3. Click the last month of the required period. The months within the period are highlighted.
      4. In the calendar, click OK. In the Period field, the dates of the selected billing period or calendar period are displayed.

      When the period is selected, the data will be loaded and displayed automatically. It may take a few moments.

  3. Optionally, configure the additional data filters:
    1. Click  Show filters. The group of filters available for the Service is displayed.
    2. Select the required parameters. The data will be updated automatically.

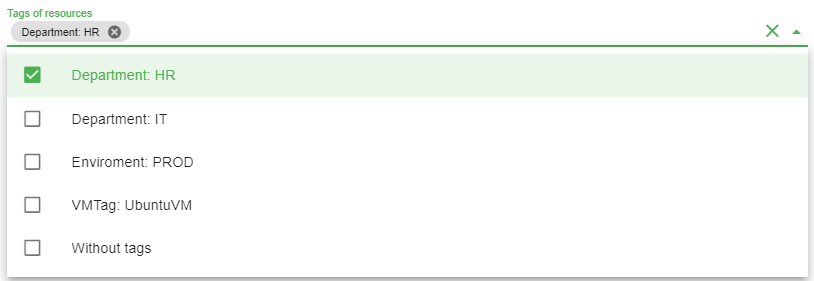
      To select the required tag of Resources:

      1. Click Tags of resources. The values of available tags are displayed grouped by the tag names. Start typing the name of a tag to filter the list.
      2. Click the required tags.
      3. Repeat the steps to select all the required tags.

      To clear a selected tag, click  next to its name. To clear all selected tags, click in the row with the tags.

      To clear all filters and set the default view, click Reset all.

      The  Show filters button is not available if the consumption data does not include any additional information for filtering.

Information about the Resource consumption for the selected period is displayed in the following sections:

Resource categories are displayed if only the consumption data includes this information. Otherwise, only the Resources data is available.

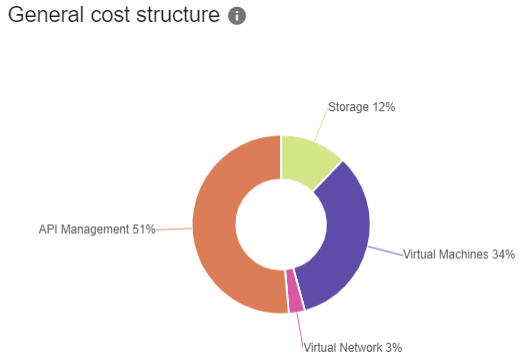
  • General cost structure — a doughnut chart where each segment shows the proportional value of consumption per Resource (Resource category). The segments have labels with the component names and percentage values.


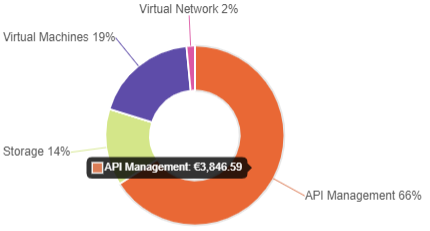
    To view the cost of a certain Resource or Resource category, hover the mouse pointer over the corresponding sector of the General cost structure chart. The tooltip with the name and cost with up to two decimal places is displayed.


    To filter the data by a Resource category:

    1. Click the corresponding sector of the General cost structure chart. The context menu is displayed.
    2. In the context menu, select Filter by resource category.
      As as a result:
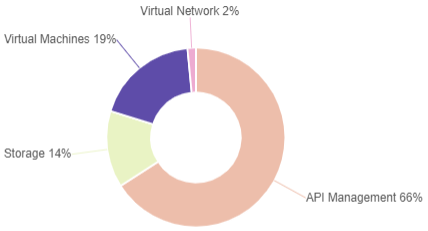
      • The other sectors of the General cost structure chart become faded.


    • The Cost structure chart and the Summary table display the data for the selected Resource category only.

    To reset filtering by a Resource category:

    1. Click the corresponding sector of the General cost structure chart. The context menu is displayed.
    2. In the context menu, select Cancel filter.

    To filter the data by a Resource, click the corresponding sector of the General cost structure chart. To reset filtering by a Resource, click the corresponding sector of the General cost structure chart one more time.

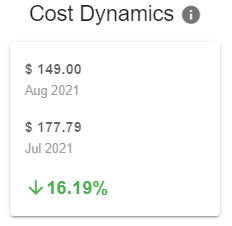
  • Cost Dynamics — the cost of the Subscription for the two previous Billing periods and the percentage of the growth rate.


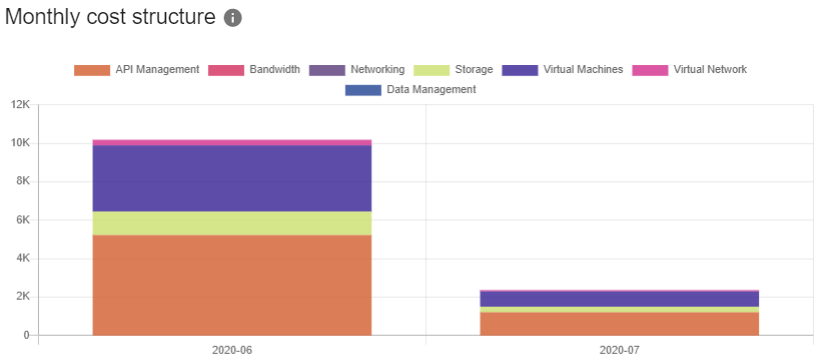
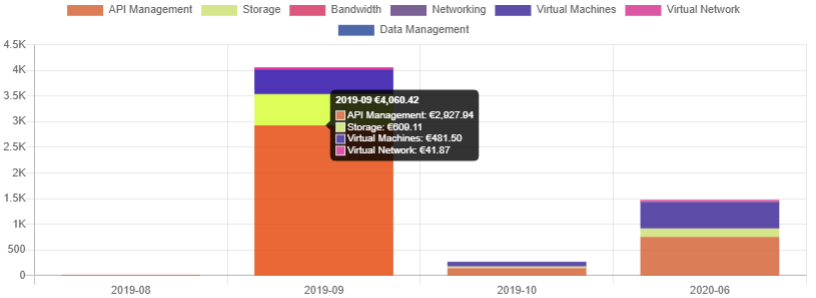
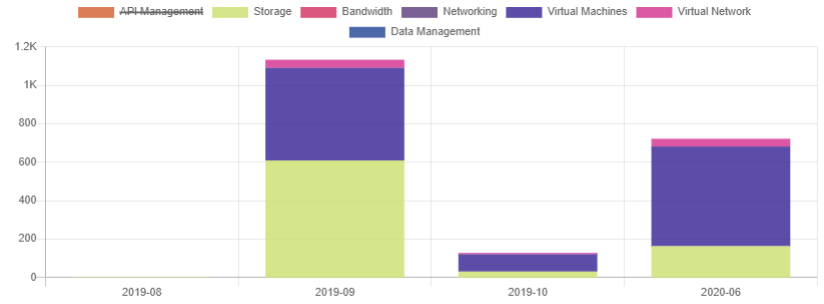
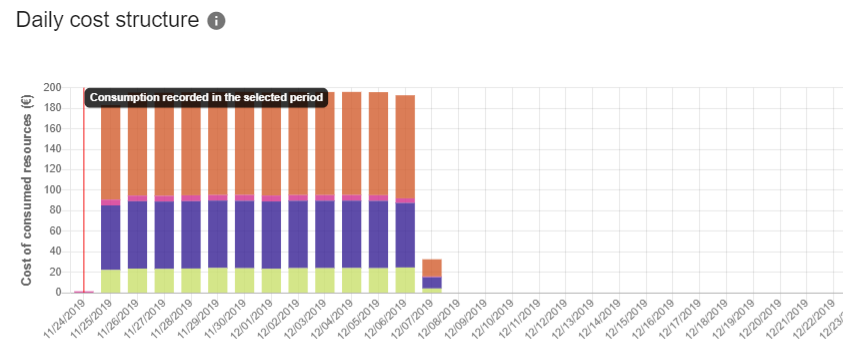
  • Daily (monthly) cost structure — a stacked bar chart that displays the cost structure of the consumed Resources by Resource or Resource category for the selected period — Daily or Monthly.


    To view the cost of all Resource or Resource categories for a certain day or month, hover the mouse pointer over the corresponding column of the Cost structure chart. The tooltip with the total cost and the costs per every Resource or Resource category with up to two decimal places are displayed.


    To exclude a certain component from the Cost structure chart, click its name in the chart legend. As as the result, the Cost structure chart is updated and does not display the excluded component.


    To view the consumed data for only one component in the Cost structure chart, you can use filtering in the General cost structure chart (see above).

    For Services that use the external storage for the Resource consumption data, the delay in the data availability may cause the difference between the date of the factual consumption of a Resource and date when the platform processed the data. As a result, a portion of the consumption data for the previous Billing period will be included in the next Billing period.

    To make this situation more clear, in the Daily cost structure chart, for the Current billing period and Previous billing period options, the tooltips are displayed for the earliest date of the factual consumption and date of the selected Billing period. The corresponding message with the explanation is also displayed on the top of the page.


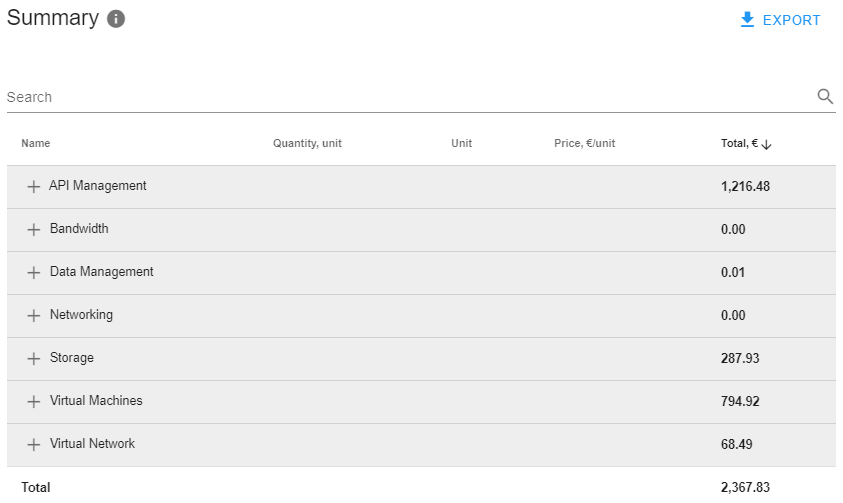
  • Summary — a table of costs of the consumed Resources by a Resource (Resource category) for the selected period.

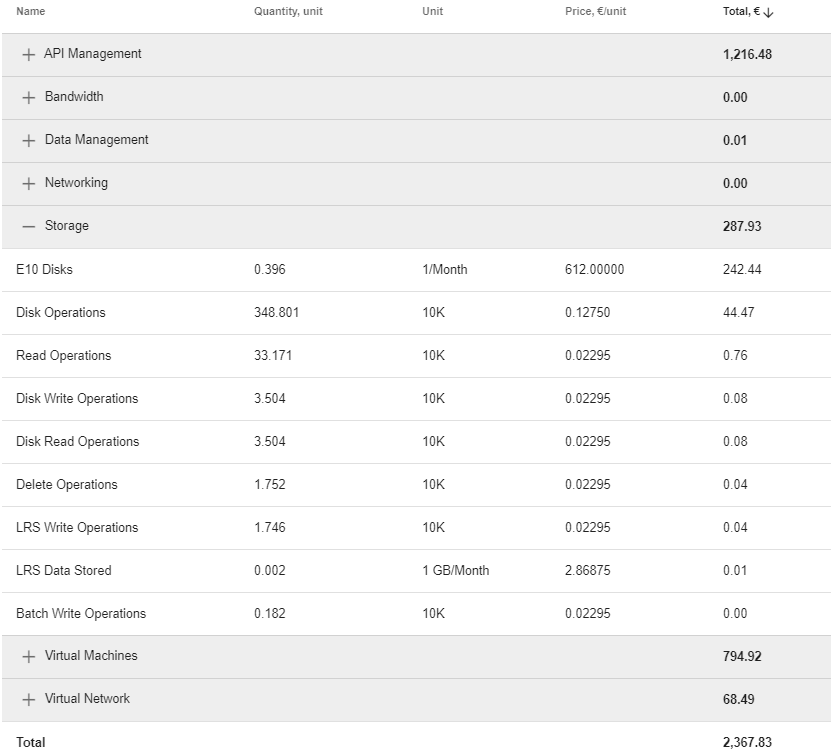
    For the Daily granularity, the Summary table includes the following columns:

    • Name  the description of the Resource (Resource category).
    • Quantity — the total number of units of the Resource (Resource category) that was used.
    • Unit — the unit of measure of the Resource (Resource category).
    • Price — the Resource (Resource category) price per unit.
    • Total — the total costs for the Resource (Resource category) for the selected period.

    If any data filters are applied, additional columns with the filter names are displayed in the table.

    The table supports the sorting of the rows by every column. By default, the Total column is used for descending sorting.

    The Name column also supports filtering by the partial-match searching. To filter the table rows, in the Search by name field, enter the search key and click .


    Depending on the available data, the rows of the table can have the following grouping levels:

    1. Resource category.
    2. Resource.

    By default, the levels are collapsed. To expand a level, click  in the required row.


    The sum of costs for a component is displayed in the Total column. In the Total row, the grand total of costs for the selected period is displayed.

    For the page navigation, the following elements are available:

    • The number of rows displayed per page.
    • The previous and next page buttons.

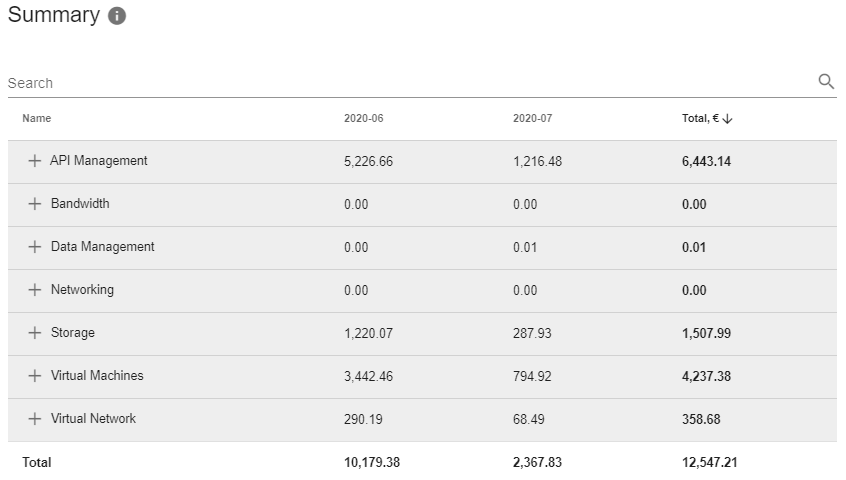
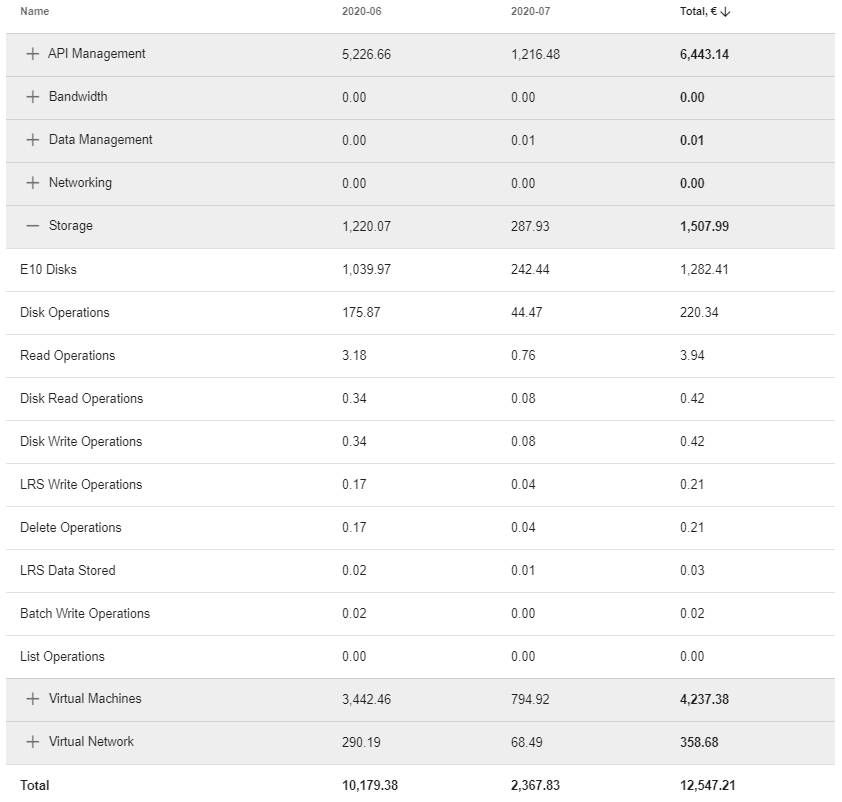
    For the Monthly granularity, the Summary table includes the following columns:

    • Name  the description of the component.
    • Year-month — the costs for the component per month.
    • Total — the total costs for the component for the selected period.

    If any data filters are applied, additional columns with the filter names are displayed in the table.

    The table supports the sorting of the rows by every column. By default, the Total column is used for descending sorting.

    The Name column also supports filtering by the partial-match searching. To filter the table rows, in the Search by name field, enter the search key and click .


    Depending on the available data, the rows of the table can have the following grouping levels:

    1. Resource category.
    2. Resource.

    By default, the levels are collapsed. To expand a level, click  in the required row.


    The sum of costs for a component is displayed in the Total column, the sum of costs of all components for a month is displayed in the Total row. At the intersection of the Total row and column, the grand total of costs for the selected period is displayed.

    To view the data in the table for more than 6 months, use the horizontal scrolling.

  • Export — download the information about consumed Resources as a report.
    To get the report:
    1. Click  Export.
    2. In the appeared menu, select the preferred file format:
      • Microsoft Excel (.XLSX)
      • CSV

      The file in the selected format is downloaded automatically. The report contains data from the Analytics page with the applied filters.