Analyzing Costs
For analyzing costs for all Subscriptions of an Account, use the Subscription Analytics section. The Subscription Analytics section includes information about Subscription costs with the following numbers:
- The cost structure for the selected period.
- The growth rate of costs per month.
- The contribution of Resources for Subscription costs.
In the Subscription Analytics section, all costs are displayed in the Reseller currency regardless of the Plan currency of Subscriptions.
For postpaid Subscriptions with prices fixed in a currency that differs from the Reseller currency, costs in the current Billing period may be changed. Recalculation of the costs is performed if the Reseller updates the currency exchange rate (see Screen Layout).
In this article:
Viewing overall analytics for Subscriptions
To view overall analytics for Subscriptions:
- Sign in to the Customer Control Panel.
On the Navigation Bar, click Analytics. The Subscription Analytics page is displayed with the data for the period set by default.
For the cost structure for all Subscriptions of an Account, only the Monthly granularity is available. For every Subscription, the displayed data is collected from daily consumption statistics for an individual period limited by the corresponding Billing days.
For example, an Account has two Subscriptions: for the Microsoft Azure service, the Billing day = 1, and for the Microsoft 365 service, [the Billing day = 5. In this case, the displayed data for the 6 billing periods includes the following different periods: for the Microsoft Azure service — 01.01.2020 – 30.06.2020, and for the Microsoft 365 — 05.01.2020 – 04.07.2020.
In the Period list, select the period for the displayed data:
- 3 billing periods.
- 6 billing periods.
- 12 billing periods.
Custom billing period — the period of up to 12 consequent Billing periods limited by the Billing days.
To select a custom billing period:
- In the Period field, click the dates range. The calendar with the list of months is displayed.
- Click the first month of the required period. The selected month is highlighted.
- Click the last month of the required period. The months within the period are highlighted.
- In the calendar, click OK. In the Period field, the dates of the selected billing period are displayed as "First month YYYY - Last month YYYY".
When the period is selected, the data will be loaded and displayed automatically. It may take a few moments.
The cost structure for all Subscriptions of the Account is displayed in the following sections:
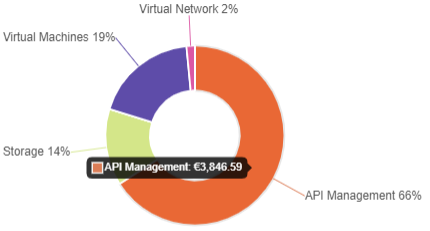
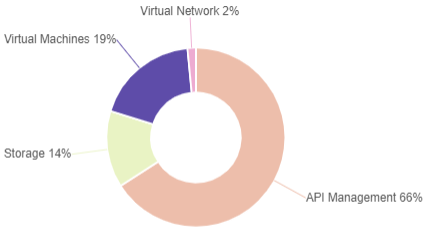
General cost structure — a doughnut chart where each segment shows the proportional value of costs per Subscription. The segments have labels with the component names and percentage values.
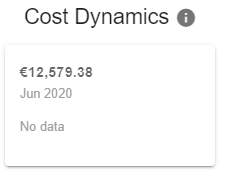
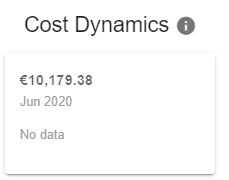
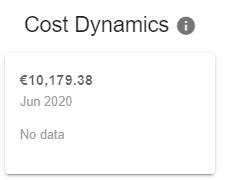
- Cost Dynamics — the cost of all Subscriptions for the two previous Billing periods and the percentage of the growth rate.
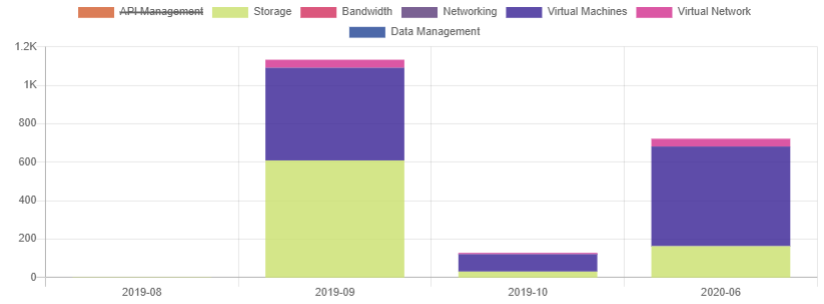
Monthly cost structure — a stacked bar chart that displays the monthly dynamics of costs per Subscription for the selected period.
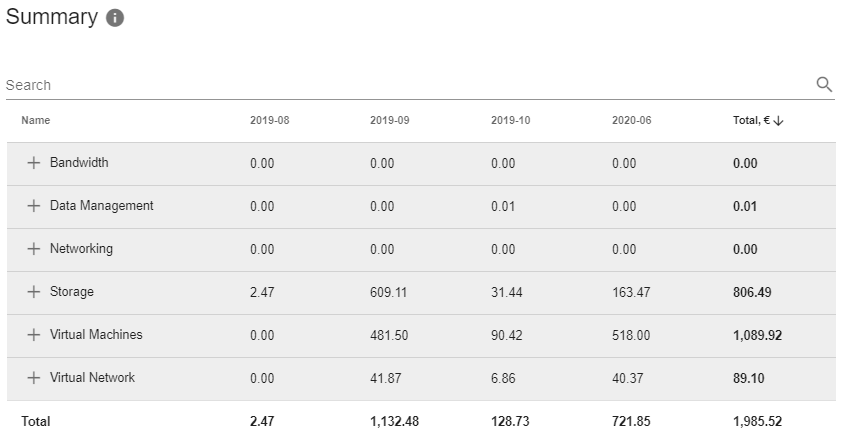
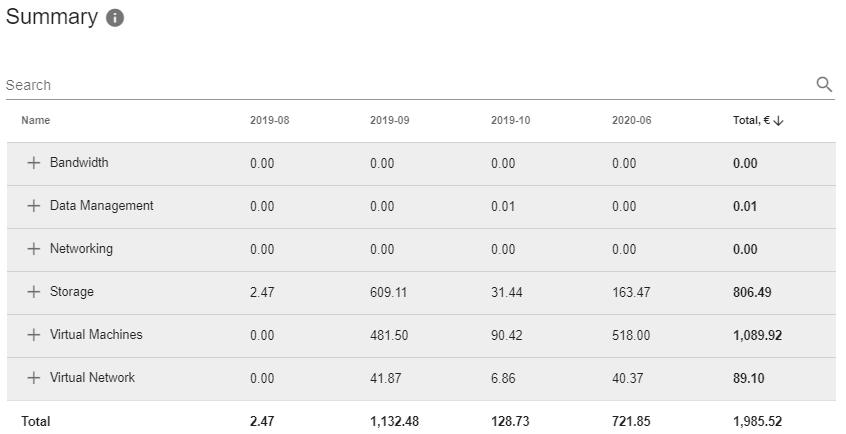
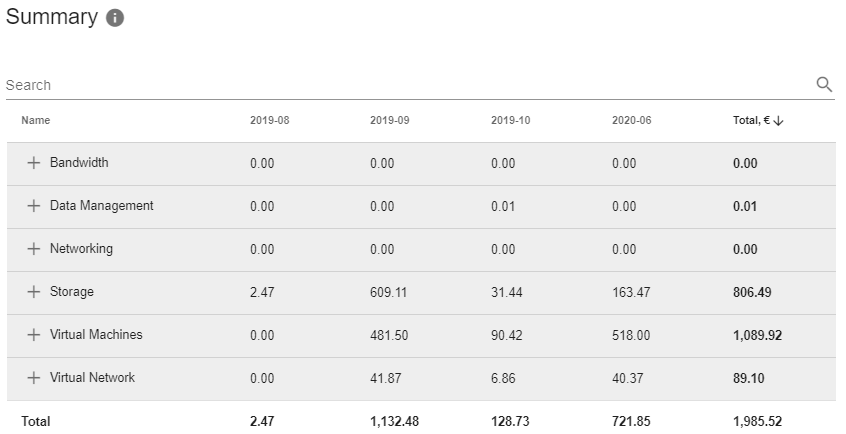
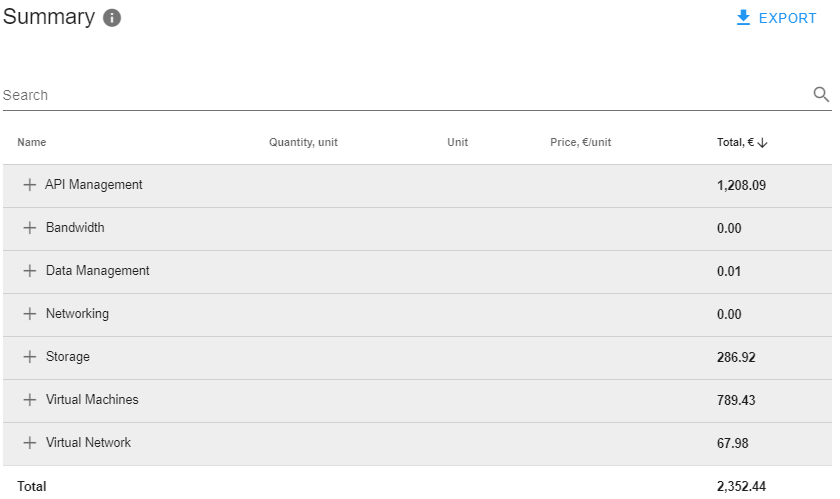
Summary — a table of costs per Subscription for the selected period.
Viewing analytics for a Subscription
Analytics for a Subscription is also available at the Analytics section of the Subscription page (see Viewing Charges for a Subscription).
To view analytics for a Subscription, on the Subscription Analytics page with data for all Subscriptions (see Viewing overall analytics for Subscriptions) complete one of the following steps:
- Select the required Subscription in the filter:
- Click Show filters. The Subscriptions filter is displayed.
- In the Subscriptions filter list, select the required Subscription.
- Select the required Subscription in the doughnut chart:
- In the General cost structure doughnut chart, click the sector that represents the required Subscription. The context menu is displayed.
- In the context menu, select Go to subscription analytics.
When the Subscription is selected, the data will be loaded and displayed automatically. Depending on the Subscription, the following elements may become available:
- In the Granularity list — the Daily option. Only for Subscriptions to Services that use the external storage for the Resource consumption data (for example, Microsoft Azure, see "Microsoft Azure" service).
- Resource Category — an additional data filter under the Show filters. Only for Subscriptions that have this information in consumption statistics.
The cost structure for the selected Subscription of the Account is displayed in the following sections:
Resource categories are displayed if only the consumption data includes this information. Otherwise, only the Resources data is available.
General cost structure — a doughnut chart where each segment shows the proportional value of costs per Resource (Resource category). The segments have labels with the component names and percentage values.
- Cost Dynamics — the cost of the selected Subscription for the two previous Billing periods and the percentage of the growth rate.
Cost structure — a stacked bar chart that displays the dynamics of costs per Resource (Resource category) for the selected period with the Daily or Monthly granularity.
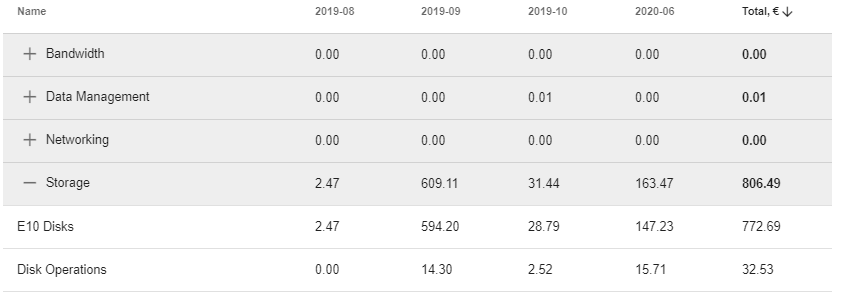
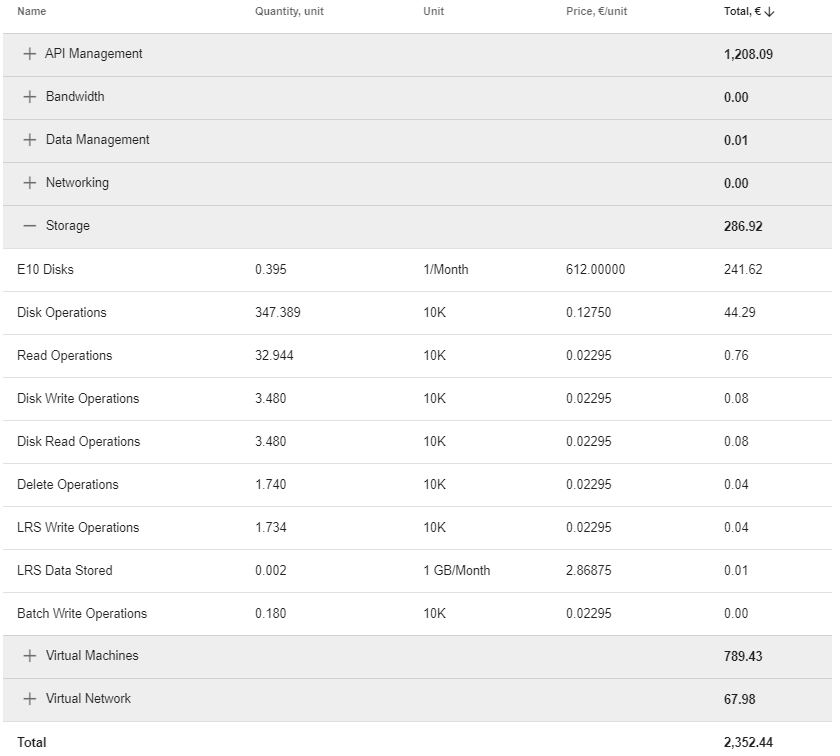
Summary — a table of costs per Resource (Resource category) for the selected period.
Data per Resource category is available only for Subscriptions that have this information in consumption statistics. Otherwise, data per Resource is displayed.
Viewing analytics for a Resource category
Viewing analytics for a Resource category of a Subscription is available only for Subscriptions that have this information in consumption statistics.
To view analytics for a Resource category of the required Subscription, on the Subscription Analytics page with data for the required Subscription (see Viewing analytics for a Subscription) complete one of the following steps:
- Select the required Resource category in the filter:
- Click Show filters. The Resource Category filter is displayed.
- In the Resource Category filter list, select the required Resource category.
- Select the required Resource category in the doughnut chart:
- In the General cost structure doughnut chart, click the sector that represents the required Resource category. The context menu is displayed.
- In the context menu, select Go to resource category analytics.
When the Resource category is selected, the data will be loaded and displayed automatically.
The cost structure for the selected Resource category of the Subscription is displayed in the following sections:
General cost structure — a doughnut chart where each segment shows the proportional value of costs per Resource. The segments have labels with the component names and percentage values.
- Cost Dynamics — the cost of the selected Resource category of the Subscription for the two previous Billing periods and the percentage of the growth rate.
Cost structure — a stacked bar chart that displays the dynamics of costs per Resource for the selected period with the Daily or Monthly granularity.
Summary — a table of costs per Resource for the selected period.
Viewing daily analytics for a Subscription for the selected period
Viewing daily analytics is available only for Subscriptions to Services that use the external storage for the Resource consumption data (for example, Microsoft Azure, see "Microsoft Azure" service).
To view daily analytics for a Subscription for the selected period, on the Subscription Analytics page with data for the required Subscription (see Viewing analytics for a Subscription) complete one of the following steps:
- Select the required period in the filters:
- In the Granularity list, select Daily.
- In the Period list, select the required period for the displayed data.
- Select the required period in the stacked bar chart:
- In the Cost structure stacked bar chart, click the bar that represents the required period. The context menu is displayed.
- In the context menu, select Go to analytics about selected period.
When the period is selected, the data will be loaded and displayed automatically.
Optionally, configure the additional data filters:
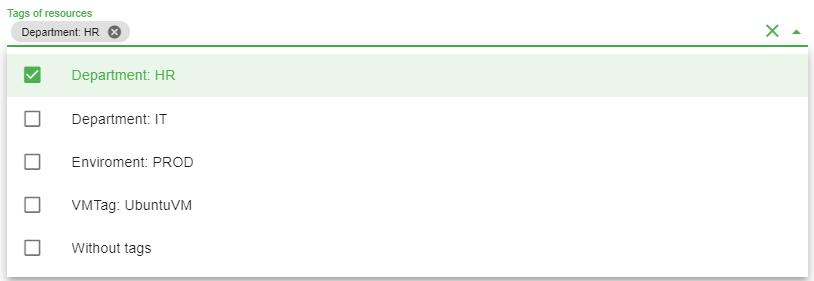
- Click Show filters. The group of filters available for the Service is displayed.
Select the required parameters. The data will be updated automatically.
To clear all filters and set the default view, click Reset all.
The Show filters button is not available if the consumption data does not include any additional information for filtering.
The cost structure for the selected Subscription of the Account is displayed in the following sections:
- General cost structure — a doughnut chart where each segment shows the proportional value of costs per Resource (Resource category). The segments have labels with the component names and percentage values.
- Cost Dynamics — the cost of the selected Subscription for the two previous Billing periods and the percentage of the growth rate.
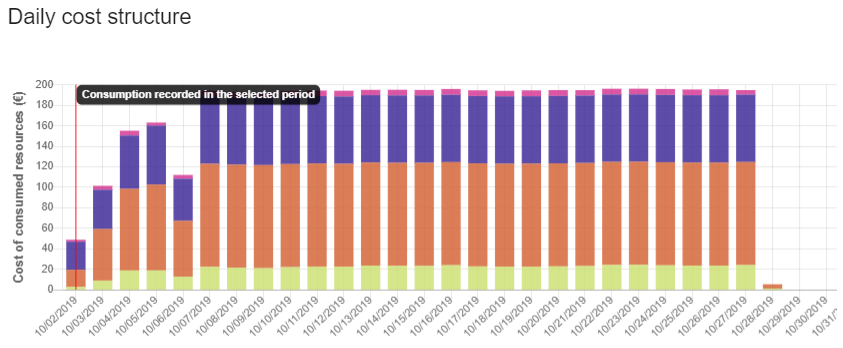
Daily Cost structure — a stacked bar chart that displays the dynamics of costs per Resource (Resource category) for the selected period with the Daily granularity.
For the instructions on how to use the General cost structure doughnut chart and Cost structure stacked bar chart, see Viewing daily analytics for a Subscription for the selected period.
Summary — a table of costs per Resource (Resource category) for the selected period.


