In the Cost overview subsection, you can explore the daily costs on the following levels:
-
Subscription — costs distribution by resources (resource categories) of a pay-as-you-go subscription.
-
Resource category — costs distribution by resources of a resource category. Available only if the pay-as-you-go subscription's consumption data contains resource category information.
In this article:
Analytics for a single pay-as-you-go subscription
To view daily analytics for a single pay-as-you-go subscription:
-
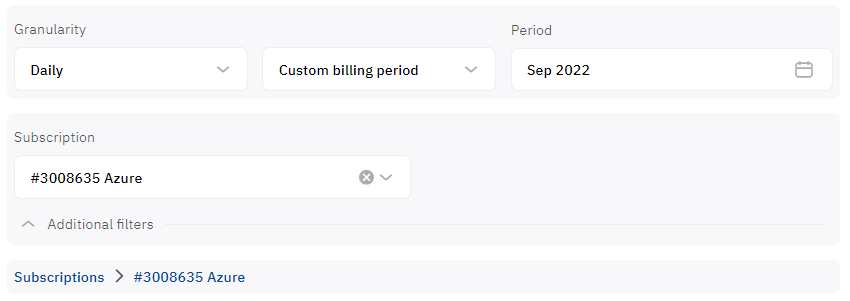
In the navigation menu, select Analytics > Cost overview. A page with data for the default filters is displayed.
-
Select the required subscription by doing any of the following:In the Subscriptions list, select the required pay-as-you-go subscription.Select the required pay-as-you-go subscription in the doughnut chart with all subscriptions:In the General cost structure doughnut chart with all subscriptions, click the sector that represents the required subscription. The context menu is displayed.In the context menu, select Go to subscription analytics.
-
In the Granularity list, select Daily.
-
In the Period list, select the period for the displayed data:
If the selected interval includes a billing period that is not yet closed, a message is displayed stating that the data is preliminary and subject to change.
-
Current billing period — default.
-
Previous billing period.
-
Custom billing period — a period of up to 3 consequent billing periods limited by the billing days. To select a custom billing period:
-
In the Period field, click the dates range. The calendar with the list of months is displayed.
-
Click the first month of the required period. The selected month is highlighted.
-
Click the last month of the required period. The months within the period are highlighted.
-
In the calendar, click OK. In the Period field, the dates of the selected billing period are displayed as "First month YYYY — Last month YYYY".
-
-
Custom calendar period — a period of up to 3 consequent months. To select a custom calendar period:
-
In the Period field, click the dates range. The calendar with the list of days is displayed.
-
Click the first day of the required period. The selected day is highlighted.
-
Click the last day of the required period. The period within the days is highlighted.
-
In the calendar, click OK. In the Period field, the dates of the selected billing period are displayed.
-
-
-
Wait until the data is loaded and displayed.
The cost structure for the selected subscription of an account is displayed in the following sections:
Resource categories are displayed only if the consumption data includes this information. Otherwise, only resource data is available.
-
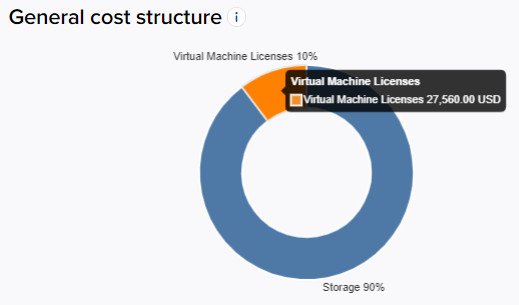
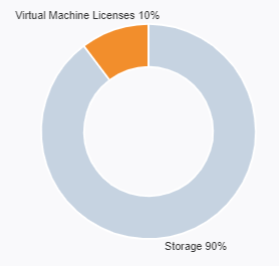
General cost structure — a doughnut chart where each segment shows the proportional value of costs per resource (resource category). The segments have labels with the component names and percentage values. The chart displays up to 10 items with the highest consumption. The rest, if present, are automatically combined into the Others group.
How to use the "General cost structure" chart for a subscription
To view the cost of a resource (resource category), hover the mouse pointer over the corresponding sector of the General cost structure chart. The tooltip with the name and cost with up to two decimal places is displayed.
A resource (resource category) may not be displayed in the diagram if its cost is less than 1% of the total cost.
To filter the data by a resource category:
-
Click the corresponding sector of the General cost structure chart. The context menu is displayed.
-
In the context menu, select Filter by resource category.
As a result:
-
-
The other sectors of the General cost structure chart become faded.
-
The Daily cost structure chart and the Summary table display the data for the selected resource category only.
-
To reset filtering by a resource category:
-
Click the corresponding sector of the General cost structure chart. The context menu is displayed.
-
In the context menu, select Cancel filter.
To filter the data by a resource, click the corresponding sector of the General cost structure chart. To reset filtering by a resource, click the corresponding sector of the General cost structure chart one more time.
-
-
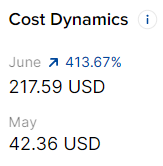
Cost Dynamics — the cost of the selected subscription for the two previous billing periods and the percentage of the growth rate.
Cost Dynamics
-
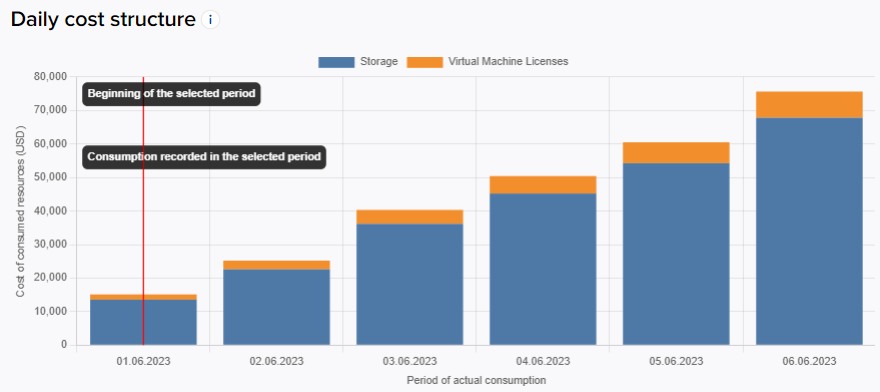
Daily cost structure — a stacked bar chart that displays the dynamics of costs per resource (resource category) for the selected period with daily granularity. The chart displays up to 10 items with the highest consumption. The rest, if present, are automatically combined into the Others group.
How to use the "Cost structure" chart for a subscription
To view the costs for a particular day, hover the mouse pointer over the corresponding column of the Cost structure chart. The tooltip with the total cost and the costs per every resource (resource category) with up to two decimal places is displayed.
To exclude a resource (resource category) from the Daily cost structure chart, click its name in the chart legend. As a result, the Daily cost structure chart is updated and does not display the excluded resource (resource category).
To view the consumed data for only one resource (resource category) in the Daily cost structure chart, you can use filtering in the General cost structure chart (see above).
Since vendors provide data with a delay, the consumption date of a resource may differ from the date it is billed in the platform. As a result, part of the consumption data from the previous billing period may be billed by the platform in the next one. In this case, when displaying data for the current or past billing period, the Daily cost structure chart additionally displays tooltips for the earliest consumption date and billing day date of the selected period, as well as an explanatory message at the top of the page.
The Daily cost structure chart may also display the Anomaly tooltips for dates with consumption spikes. For details, see Detected anomalies.
-
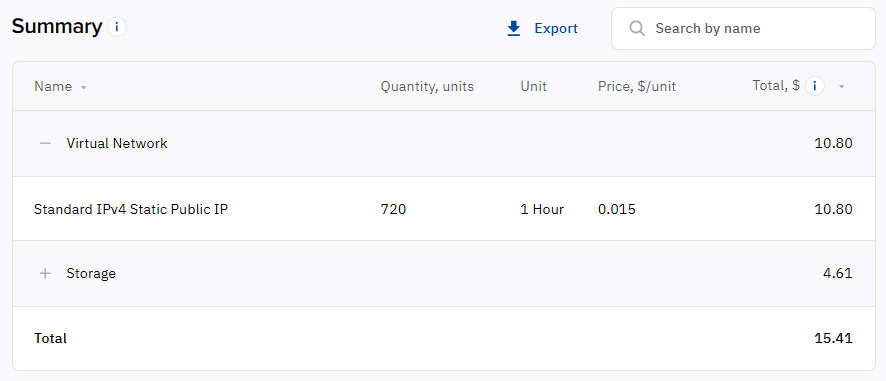
Summary — a table of costs per resource (resource category) for the selected period.
If the data in the table does not fit in width, use horizontal scrolling.
How to use the "Summary" table for a subscription
The Summary table includes the following columns:
-
Name — the name of a resource (resource category).
-
Quantity — the number of consumed units of a resource.
-
Unit — the unit of measure of a resource.
-
Price — the unit price of a resource.
-
Total — the total costs for a resource (resource category) for the selected period, all discounts included.
The sum of costs for a resource (resource category) is displayed in the Total column.
The table supports the sorting of the rows by every column. By default, the Total column is used for descending sorting.
The Name column also supports filtering by partial-match searching. To filter the table rows, start entering the search key in the Search by name

For resource categories, data is grouped by resources in the rows, and the rows are collapsed by default. To view information about resources, click

-
-
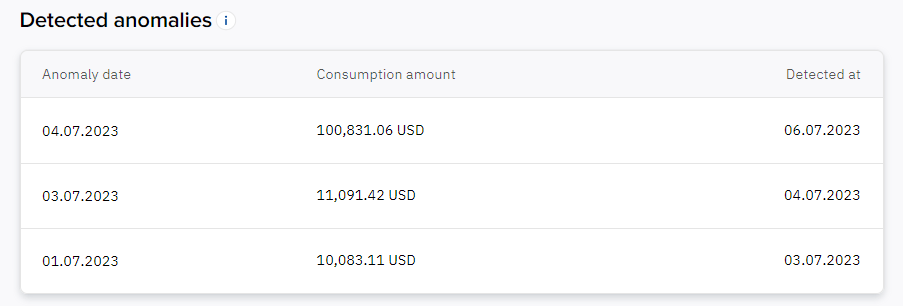
Detected anomalies — a table with information about the consumption spikes the platform detected (if any).
How to use the "Detected anomalies" table
Your reseller may activate automatic monitoring of consumption anomalies for all pay-as-you-go subscriptions. In this case, the platform compares the day-to-day difference in consumption for a subscription and notifies the Owner of an account about a significant consumption spike.
In addition to the notifications, in the Detected anomalies table, you can view information about the consumption spikes the platform detected in the current month. The table includes the following columns:
-
Anomaly date — the date when a consumption spike occurred.
-
Consumption amount — a value with the reseller currency units.
-
Detected at — the date when a consumption spike was detected. This date may differ from the consumption date because vendors usually provide data with a delay of up to 2 days.
On the Monitoring tab of a subscription details page (see Subscription details), you can also view information about the consumption spikes the platform detected over the past year.
-
Filters
For analytics of a single pay-as-you-go subscription, you can use different filters. By default, the filter group is collapsed. To view and use the filters, click Additional filters and select the required options in the lists:
-
Category — analytics for a single resource category, see Monthly analytics.
-
Other filters — for details, see the corresponding service in .
To reset a filter, click 
Filter templates
Export
To use extended reporting tools, see Reports.
You can export the summary of daily analytics of a single pay-as-you-go subscription to a Microsoft Excel (.xlsx) report:
-
Set the filters to select the information you need in a report.
-
Above the Summary table, click Export.
A file is downloaded automatically. The report name contains the ID and name of the subscription (up to 30 characters), and the selected period in the YYYYMMDD or YYYYMM format.
A report includes the following columns:
-
Resource category
-
Resource name
-
Quantity, units
-
Unit
-
Price, unit
-
Total
-
Currency